While catching up on my reading I came across an interesting piece in the Alabama Living magazine & that was that Cullman Electric Cooperative was now allowing one to view their daily electricity usage online. They have joined up with MyUsage.com that provides this service for 41 different utilities, located in 13 different states (3 in Alabama, Chelco Florida, 11 in Georgia, Parke County Indiana, Mayfield Kentucky, 3 in Missouri, Delta EPA Mississippi, 3 in North Carolina, 7 in Oklahoma, 2 in Oregon, 5 in South Carolina, Southwest Tennessee, & 2 in Texas). Needless to say, this has led to a few questions like what is a smart meter, why should I care, how hard is it to setup, what are the pros & cons, and finally are there any better options?
What is a Smart Meter & why should I care?
While I would love to point one to the local coop’s page, they do not have one setup, so I will gladly point you to one of the best Utility Providers I know of, which is SRP (Salt River Project) to help explain this.
As we mentioned in our October is National Energy Awareness Month article where we include our free tracking tool, we like to track our usage for spotting issues, seeing what happens when we make changes, budgeting and numerous other items. The biggest catch with this is that one generally will not catch an issue until it has been happening for a while, and you cannot monitor your usage daily. By being able to monitor your usage daily, one can see what some simple changes made actually do to your usage.
In many households, some parents have turned it into a game for their kids (shutting off lights, not leaving doors open, etc…) with a reward if the usage gets below X. In some cases, it is actually the kids leading the charge and helping their parents shave 10% or more off their electric bills.
The 7-step setup process:
- Go to https://www.myusage.com/ & either click where indicated or where we placed the circle .
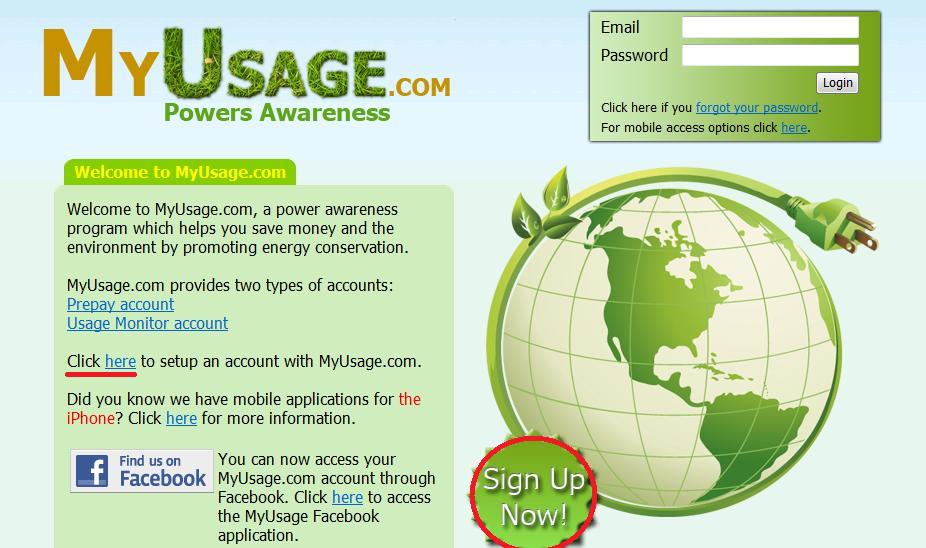
- Use the dropdown box & select your state – Click Next

- If you’re electric provider is there select the appropriate one – Click NEXT
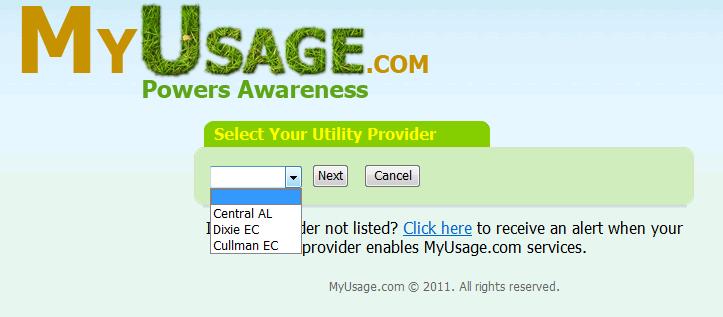
- If your provider is not there / nothing offered in your state, you might want to contact your local utility as there are numerous companies offering this service like Google, the Utility itself, etc… (We also encourage you skip to the bottom where we address the other options available)
- Enter a valid email address where we show – Click NEXT
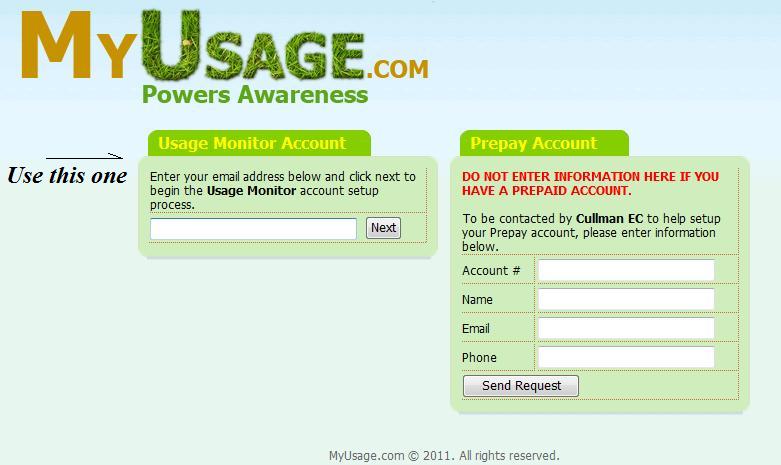
- This is necessary to validate your account and to receive your daily summary
- As for the prepay option, well that is something you might want to consider looking into if your utility waives certain fees or you believe it will help you watch & control your usage. As for any benefits that Cullman EC might offer, I do not know, as I cannot find anything on their site. (EDIT 3.13.11: amazingly they now have documents up dated February 1st, but they were not their when I wrote this article… )
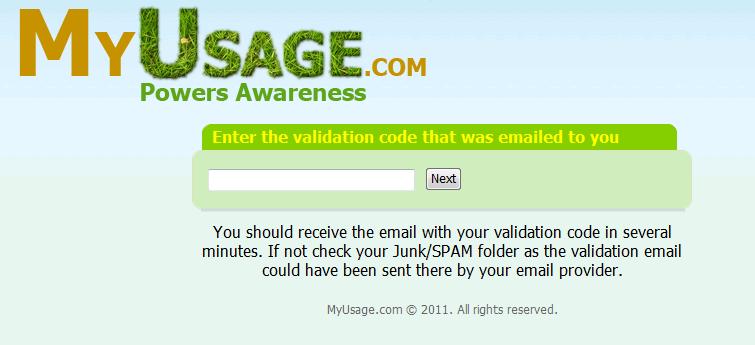
- I waited about 15 minutes for mine, but once you receive the email with your validation code you can simply highlight it, copy (CTRL + C) and paste it (CTRL + V) in the appropriate area – Click NEXT
- Hopefully you know your account number & meter number (located on your bill as shown below) – if so enter them as appropriate – Click NEXT
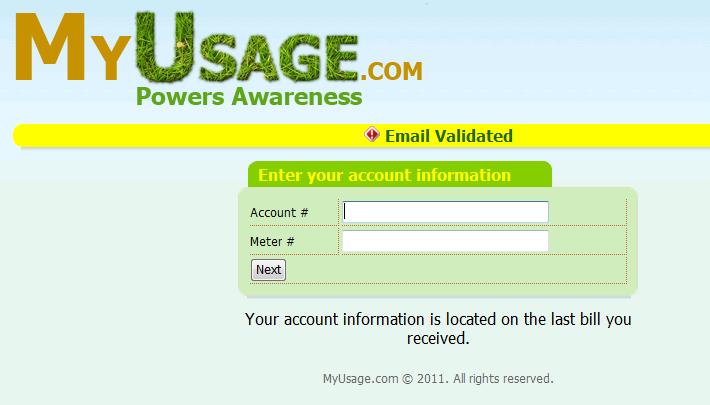
- In case you have tossed all your bills, hopefully you have written your account number on your checks
- Your meter number is actually quite easy to find, as it is on your meter (In fact, it might be a good idea to verify that what is on your meter matches your bill) .
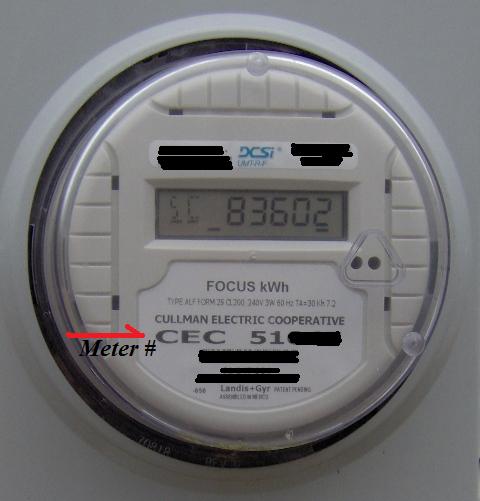
- If you have problems, finding any of the above I am sure your utility company will be glad to help you out
- Your final step is to setup a password, retype in your email, and select when & how you wish to be notified .
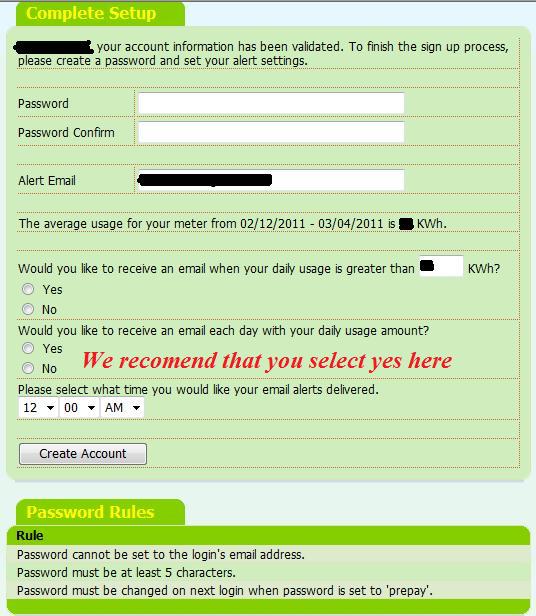
The Reports & Emails:
This is the first report you will notice & while this one only shows 20 days instead of the listed 30, it gives you a quick summary look at your usage patterns & average use. (Quick note – the 20 vs. 30 issue is because of the information provided to MyUsage)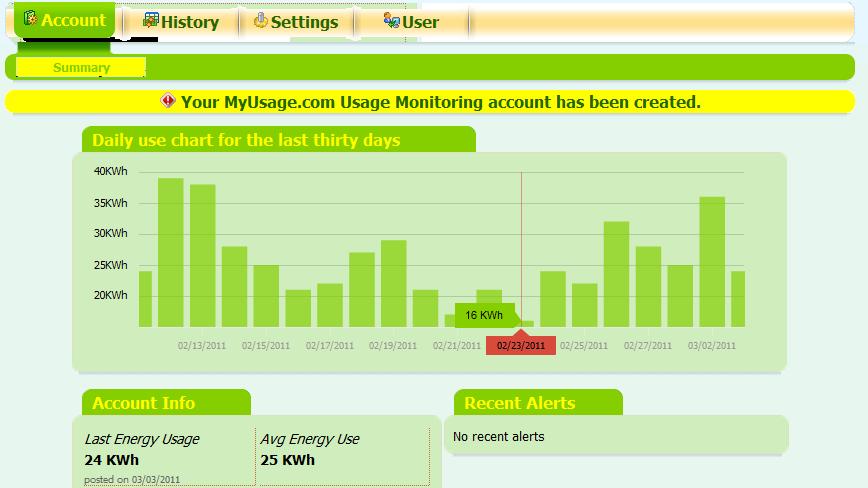
Just as a quick glance – the 23rd shows how much power is normally consumed by all the appliances and other loads when nobody was home for the entire day and most of the night. If you also extrapolate out the dates, you can see that most of our power usage is on the weekends when the laundry is done, kids are playing the Xbox all day, etc…
The History / Usage History adds in the low & high temperatures for the day, while the Chart graphs out what the average temperature was for the day. This should help you pinpoint any spikes that maybe related to the actual weather conditions.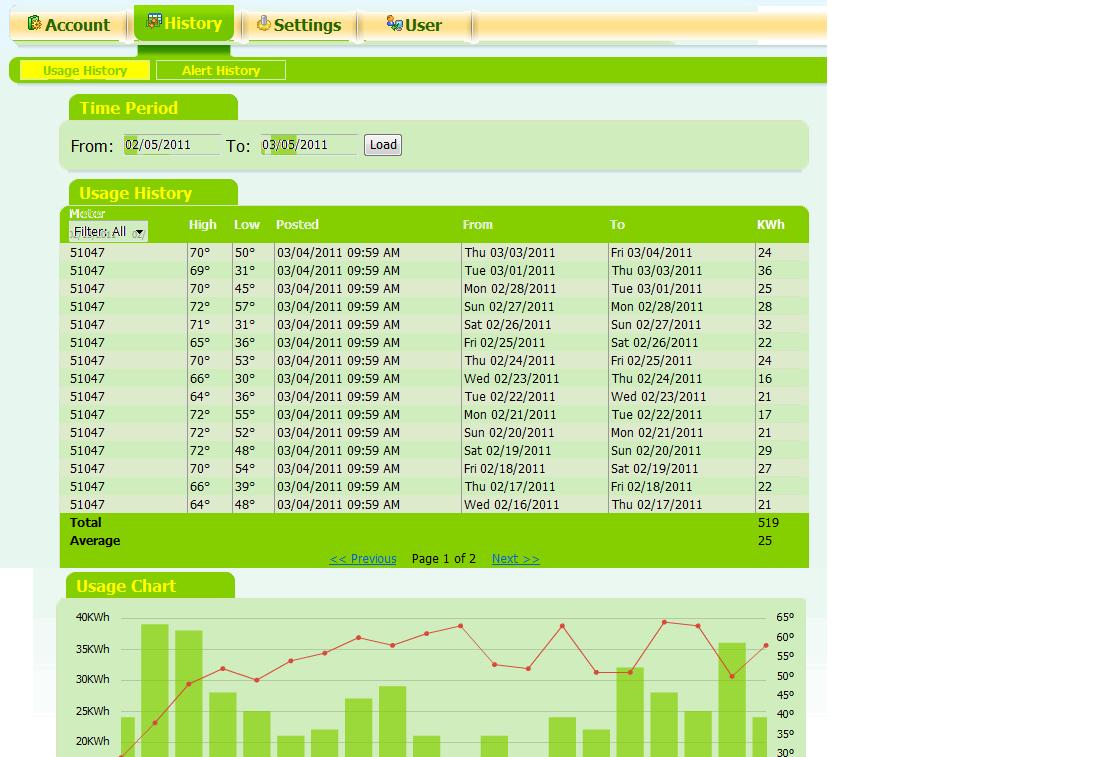
This is a copy of the email report you will receive each day (assuming you selected that option above). The interesting item on this is that it helps you spot a day where the reporting feature happened to fall through. The one reason we also like this option, is that the report is conveniently delivered to your inbox each morning & you don’t have to worry about going to their website everyday.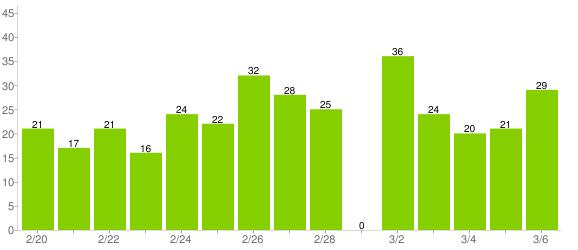
The Pros & Cons:
I think we have pretty well addressed most of the pros to utilizing this above & there truly is no cons involved with gaining as much information on your usage & acting on it. With that said, there are a few cons to this system compared to others. The problem is not with the meters, or that they do not support these options, but instead with the deployment / system selected. For example, Alabama Power can do all the items listed below from the main office. Unfortunately, though for their customers it has not been rolled out yet.
- Limited to daily reporting whereas other systems (like Google’s Power Meter) breaks it down into 15-minute periods
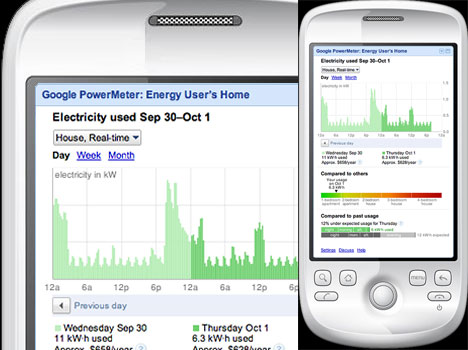
- Unable to access data in real-time or see your current reading
- Unable to compare your current month to prior months or years
- Inability to export the data into a spreadsheet program for comparison or tracking purposes
Other Options:
So what happens if your utility company does not offer this service, or does not offer everything you would like to know about? Well the first place to check with is your local utility, as they will be able to tell you what their current plans our & would love (well probably would) to hear about ways that they can help serve their customers better.
The second option involves you actually tracking your usage with items like a $99 Blue Line Powercost Meter (it reads the display or dial on certain meters & displays it inside the house), monitoring single devices or entire entertainment systems to see how much power is used by them (i.e. using a Kill-A-Watt surge strip). If you are looking for the Cadillac of systems, you might be looking at an Energy Monitoring System that will actually tell you how much electricity is being used overall & by circuit.
More Information & Websites:
- Energy Circle – a Primer on Energy Monitoring
- Part 1 – Home Energy Monitoring: Knowledge Is Power
- Part 2 – Home Energy Monitoring: Types of Monitoring Systems
- Part 3 – Home Energy Monitoring: The Wrap-Up (Costs, the future, etc…)

Man.. I like the colours on this website. It was the most refreshing yet. My site is about Smart Meters but I really felt “Green” when I came here 😉
Man.. I like the colours on this website. It was the most refreshing yet. My site is about Smart Meters but I really felt “Green” when I came here 😉