 I love salesmen, the ultimate bringers of truth, justice, and the American way. Oops… I’m sorry about that & yes you can wipe the coffee off your monitor – I promise no more bad jokes. In all seriousness, while there are many well intentioned companies, individuals, and programs that love to talk about “home performance” or “energy efficiency” they start getting into real trouble when they start trying to tie it into “energy-savings.” In order to understand why, let’s start with the basics…
The Bill:
When you mention savings, most people immediately picture their utility bill & rightfully so. I mean if you are going to see savings, it should be obvious right?
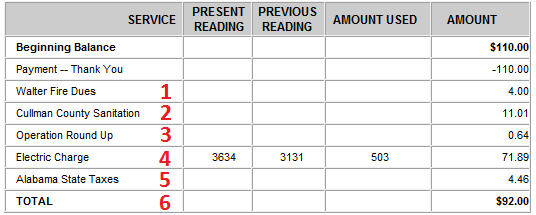
Yes, that is a copy of my most recent bill which after the obligatory prior balance & payment we arrive at the actual charges. Ahh, do you spot the first issue where one’s perception might not meet reality?
 Monitoring your usage long term is the best way to determine or verify if something is working or not for you. That is one of the reasons why we have provided a simple “Utility Spreadsheet” for anyone to download and use. For directions & thoughts on using this spreadsheet I recommend checking out our article from 2010 on National Energy Awareness Month. Monitoring your usage long term is the best way to determine or verify if something is working or not for you. That is one of the reasons why we have provided a simple “Utility Spreadsheet” for anyone to download and use. For directions & thoughts on using this spreadsheet I recommend checking out our article from 2010 on National Energy Awareness Month. |
As you can see there are only 5 line items on mine which make up the total bill, but it isn’t until we hit line 4 that we get to how much energy we used. Take a second and look at yours, you might even have a few more fees like a base usage fee, or meter reading fee & who knows what else. This brings us to the one simple truth, just because you reduce your usage by 10% or more, it doesn’t mean that your bill will be 10% less.
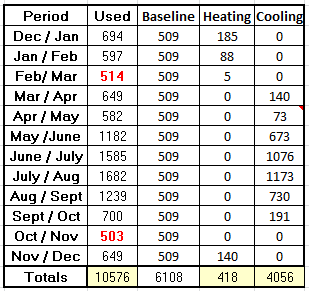
This is a snapshot of our family’s usage over the last 6 years which drives home our point from above – just because we reduced overall consumption by almost 40% via various means, our bill is only 22% less. While some of this has to with fees, the rest is basically composed of rate increases.
The types of savings
Change out your AC unit & you will save 21% according to one program or as many salesmen will tell you “a whole lot more like…” Really? Well let’s take a closer and a slightly different look at the bills.
 In this instance I broke this last year’s usage up into three columns; a baseline, heating, and cooling. The baseline simply is your normal electricity usage for everyday items like cooking, washing clothes, entertaining, not stubbing your toe in the dark, etc… With this point established, you can basically assume that everything else relates to either heating or cooling.
.
.
So let’s assume that the program is… shoot, let’s just use the 50% claim I have heard from others before & say everything works out like they say – is that 50% off your whole electric bill, just the KWh portion, or just the cooling portion? Yep, you got it, it would just be just the cooling portion. Using the numbers above for the whole year, that equates to a little more than a 19% reduction in KWh usage which roughly translates to seeing maybe a 10% actual difference overall for the year. Ahh, but how about for the summer months – well I used July which was the largest & that equates to 35% KWh reduction which roughly equals 20% off the bill or $40 savings for a month. Truthfully that isn’t bad, especially if the rates keep going up.
Which upgrades affect which Usage Type:
|
SEER & AFUE
Two of the most popular items for measuring efficiency revolve around the SEER & AFUE ratings. Both items are very similar as far as the higher the number, the more efficient the unit is. In the case of the AFUE, the rating basically means for every dollar you spend on heating that much actually goes to heating while the rest essentially goes up the chimney. The one catch with that is it only applies to the combustion process not any electricity needed. (My winter usage above actually shows that along with a space heater that we use)
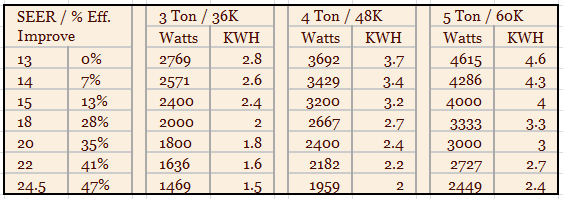
The second one which impacts cooling costs is the SEER or Seasonal Energy Efficiency Ratio. While some take issues with how it is calculated, it is a decent measure to determine “savings”. In order to determine how much energy you will save with a higher SEER unit, the process is very simple – take the units cooling power (1 ton = 12,000 BTU cooling power) & divide that by the SEER rating. This will give you how approx. how many watts will be used for each full hour that the unit is active. For example here is a chart for a 3, 4, & 5 ton units.
Hopefully by understanding some of the basics, you will have a better grasp on how these numbers do impact you and your bottom line. Of course as the saying goes, there’s more to the story – in this case there is a lot more than just “savings” which many of us simply consider the cherry on the top…


